

Earnings Week 11/1 - 11/5
Earnings Week 11/1 - 11/5
What a rollercoaster of a week.

Hey reader! 📰
If you’re new here, welcome and if not, welcome back! If you haven’t joined the 462 subscribed members yet and would like to get an earnings summary each Saturday during each earnings season, you can sign up below for FREE.
If you missed last week's recap you can read it here.
A friendly reminder that the stock price reaction after earnings might have nothing to with how well/bad the company performed during the quarter.
If you have any companies that are reporting earnings next week and want them to be included, let me know in the comments. And if you’d like, you can subscribe to my Youtube channel below (approaching 20K!).
I’ll stop wasting your time now and get right into the companies.
Tuesday, November 2
Corsair
For report here
Net revenue was $391.1 million, -14.4% YOY.
Gamer and creator peripherals segment net revenue was $139.3 million, a decrease of 13.8% YOY.
Gaming components and systems segment net revenue was $251.9 million, a decrease of 14.8% YOY.Net income was $1.8 million, or $0.02 per diluted share, compared to net income of $36.4 million in the same period last year, or $0.40 per diluted share.
Adjusted net income was $16.3 million, or $0.16 per diluted share, compared to adjusted net income of $48.5 million in the same period last year, or $0.54 per diluted share.
Adjusted EBITDA was $27.6 million, a decrease of 56.6% year-over-year.
For the full year 2021 guidance:
Net revenue to be in the range of $1.825 billion to $1.925 billion.
Adjusted operating income to be in the range of $180 million to $195 million.
Adjusted EBITDA to be in the range of $190 million to $205 million.
Stock ended the week up 7%

Activision
For report here
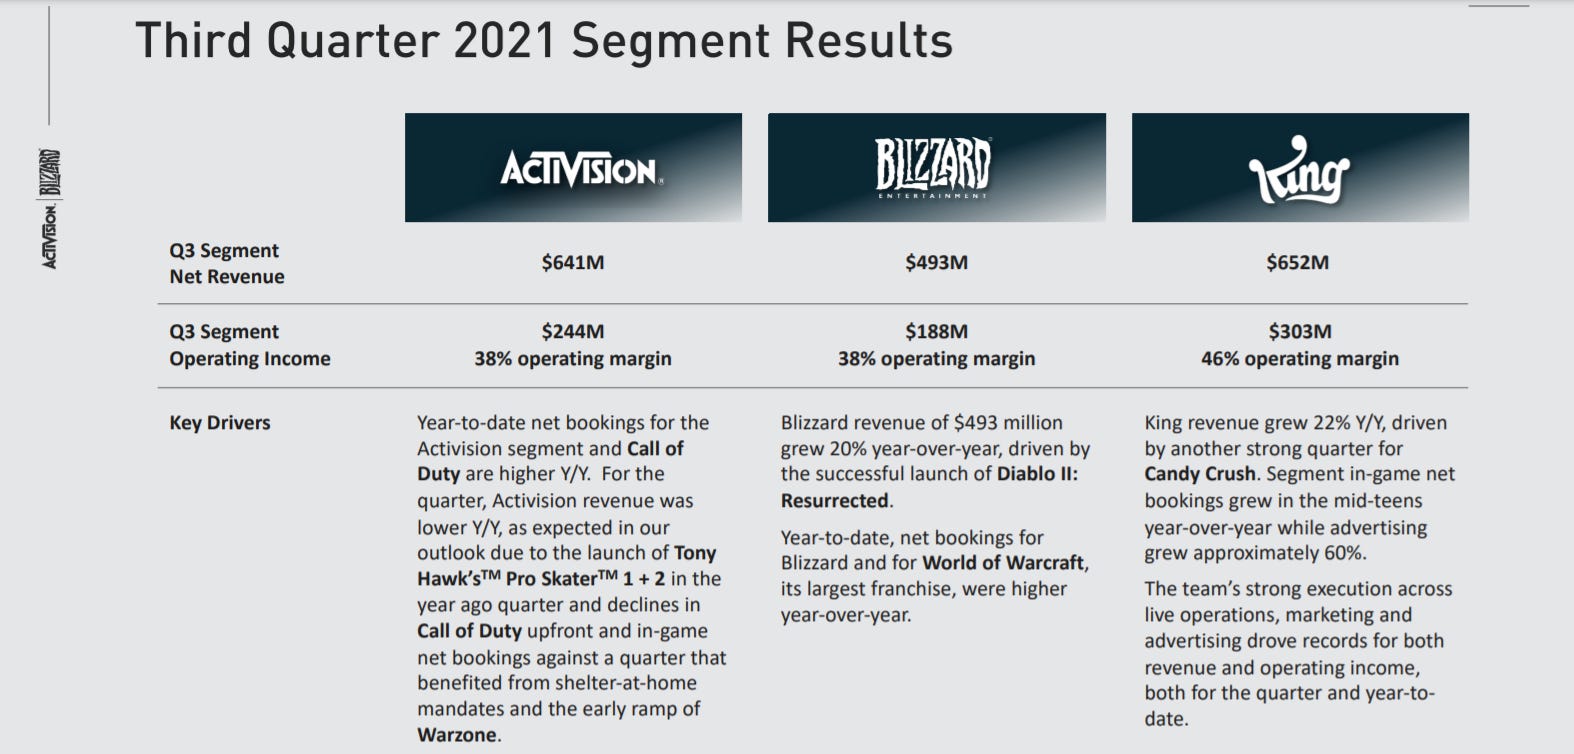
Activision had 119 million MAUs in the third quarter.
Blizzard segment revenue grew 20% YOY and had 26 million MAUs.
King segment revenue grew 22% YOY to a new quarterly record. King had 245 million MAUs in the third quarter.
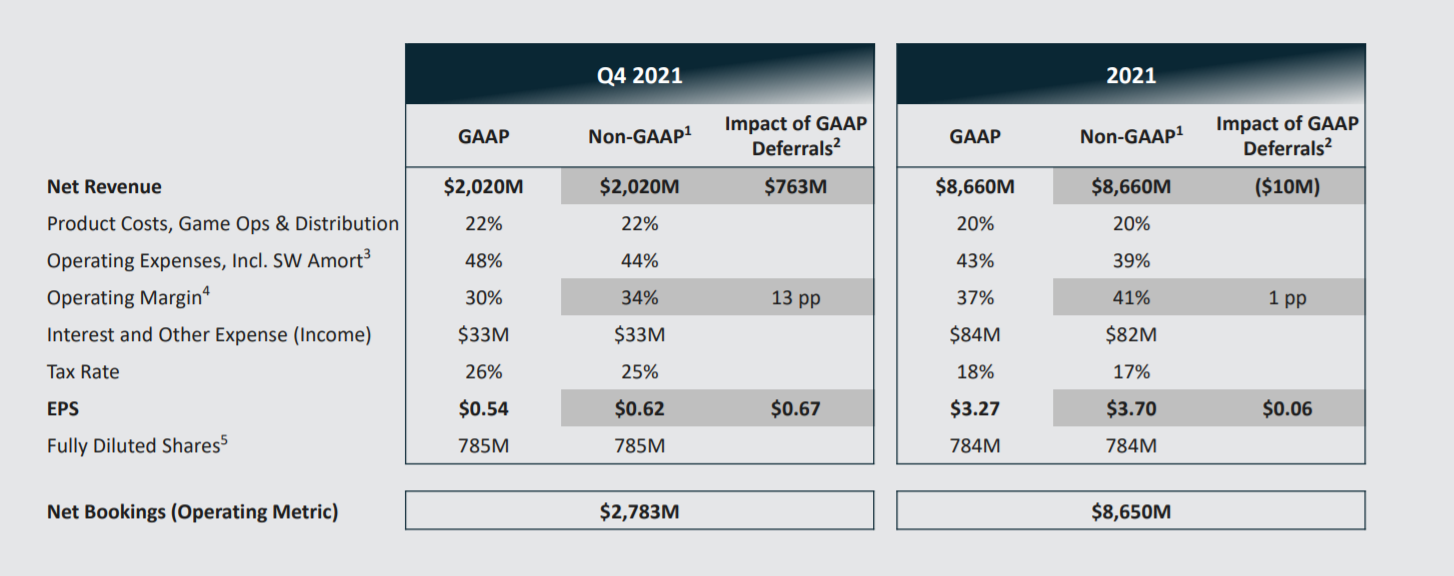
Guidance for Q4 and FY
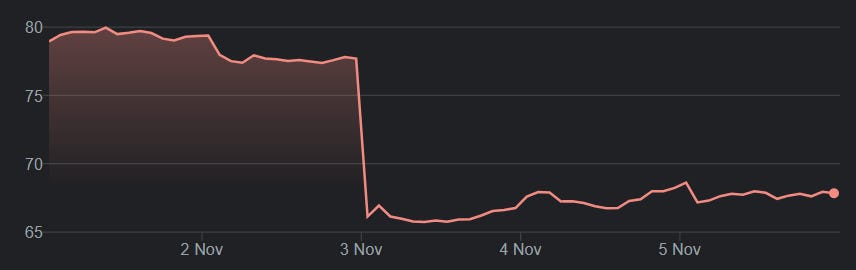
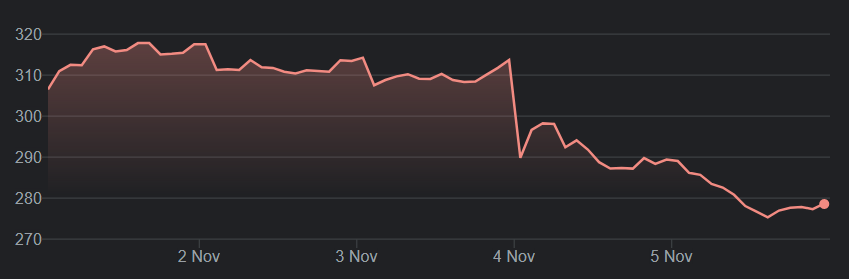
Stock ended the week down 14%
Zillow
For report here
Stock ended the week down 35%

Wednesday, November 3
Roku
For report here and video here (will post the link to the recorded Space when it’s on Spotify)
The company reported total net revenue of $680 million, growing 51% year over year (YOY), with platform revenue increasing 82% and player revenue decreasing 26%. The latter is a result of ongoing supply chain issues.
Gross profit was up 69% YOY to $364 million.
Active accounts reached 56.4 million, a net increase of 1.3 million active accounts from Q2 2021. The slowdown in growth is due to the negative impact that global supply chain issues are having on U.S. TV sales.
Streaming hours were 18 billion hours, an increase of 0.7 billion hours from Q2 2021.
Average revenue per user grew to $40.10, which is up 49% YOY.
Weak guidance for Q4, which is the holiday quarter and usually very strong.
Total net revenue to come in at a midpoint of $892.5 million, representing a 37% growth YOY.
Total gross profit of $385 million, representing a 37% growth YOY.
Adjusted EBITDA of $70 million.
Stock ended the week down 9%
Fastly
For report here
Top-line growth of 23% YOY with revenue of $87 million, net of a $0.9 million deferred revenue write-down related to purchase accounting adjustments from the Signal Sciences acquisition
Enterprise customer count increased to 430 from 408 in Q2 2021
Total customer count increased to 2,748 from 2,581 in Q2 2021
Net Retention Rate (NRR) of 112%, compared to 93% in Q2 2021
Last-twelve-month (LTM) NRR of 114%, compared to 121% in Q2 2021
Dollar-Based Net Expansion Rate (DBNER) of 118%, compared to 126% in Q2 2021
Average enterprise customer spend of approximately $698,000, compared to $702,000 in Q2 2021
Enterprise customers generated 88% of our trailing twelve-month total revenue, essentially flat since Q2 2021Gross margin 57.5% and gross profit of $49.86 million
Outlook

Stock ended the week down 1.6%
Etsy
For report here
I’ll be keeping it simple with this one.
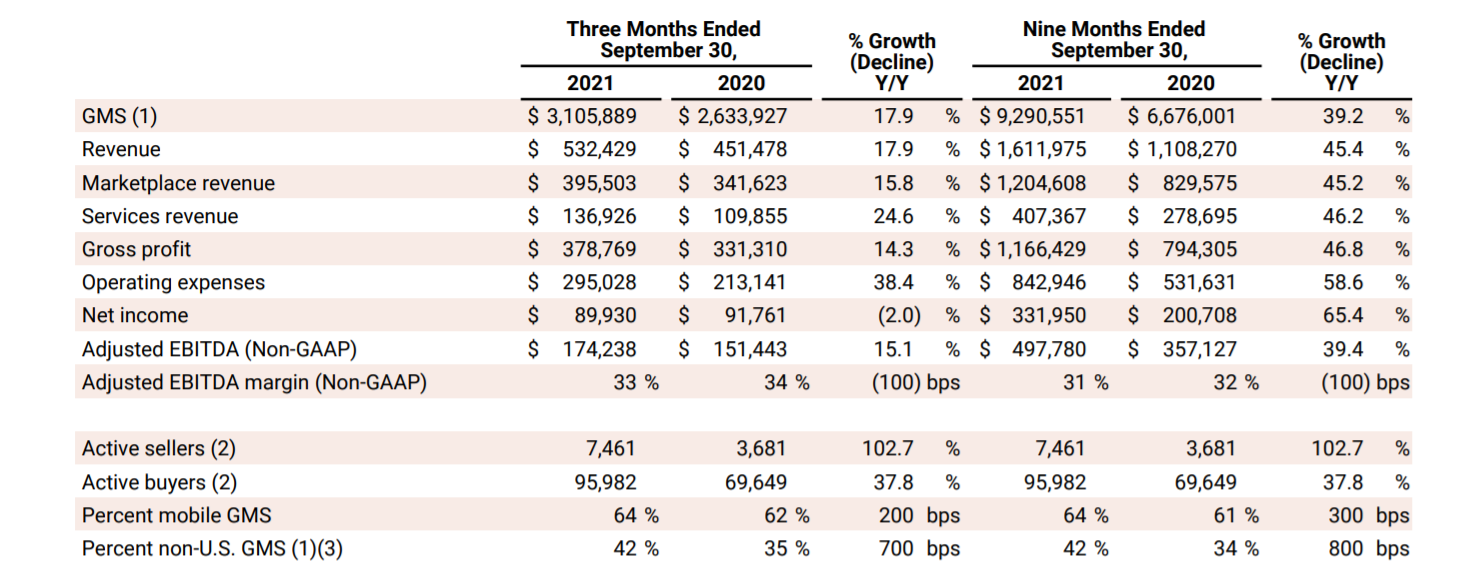
Outlook

Stock ended the week up 3.6%
Thursday, November 4
Square
For report here and video here
The company reported total net revenue of $3.84 billion in the third quarter of 2021, up 27% year over year (YOY) and missing estimates of $4.48 billion.
Excluding Bitcoin, total net revenue in the third quarter was $2.03 billion, up 45% YOY.
Bitcoin revenue was $1.81 billion, up just 11% YOY, and Bitcoin gross profit was only $42 million, which was surprising since Bitcoin went from $30k to $50K during that Q. On the call, Jack Dorsey reiterated that Square will not add any other cryptocurrencies to Cash App, which in shareholders' eyes might be a big red flag.
Gross profit was $1.13 billion, up 43% YOY and up 51% on a two-year CAGR basis (which is a better comparison to show how the long-term trend will continue).
Seller gross profit grew 48% YOY to $606 million and 29% on a two-year CAGR basis.
Cash App gross profit grew 33% YOY but was down quarter over quarter to $512 million and 104% on a two-year CAGR basis.
Teens can now use Cash App with their parents' or guardians' consent. This audience represents 20 million people in the US.
In 2022, Square will continue to expand its product offering and expand into new markets as well as approach larger sellers.
The Afterpay acquisition is expected to close in Q1 of 2022.
As of now, long-term investors have nothing to fear. But we should keep a close eye on Dorsey's Bitcoin-maximalist views because he might turn Square into Twitter…
Stock ended the week down 6.9%
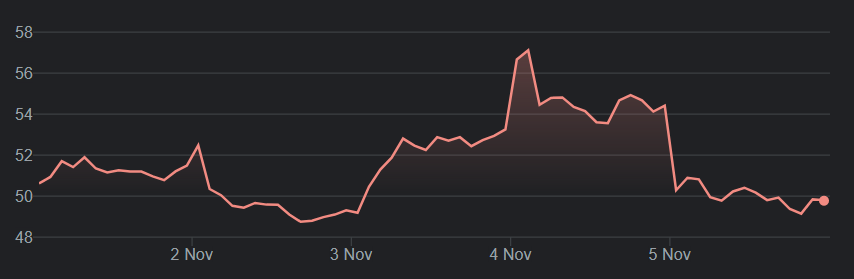
Peloton
For report here
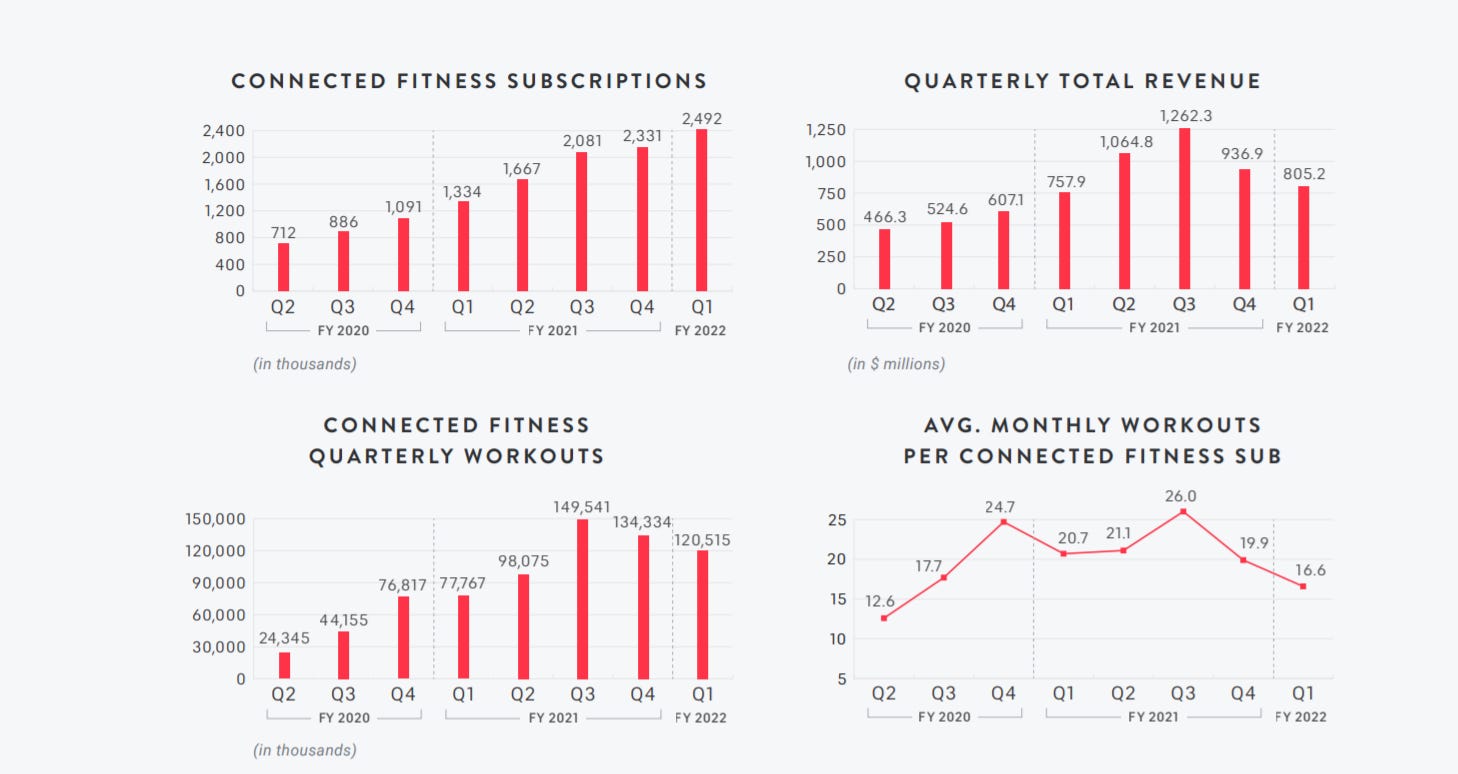
Connected Fitness Subscriptions grew 87% to 2.49 million and paid Digital Subscriptions grew 74% to 887 thousand; total Members grew to over 6.2 million
Q1 total revenue grew 6% to $805.2 million
Q1 Connected Fitness Subscription Workouts grew 55% to 120.5 million, averaging 16.6 Monthly Workouts per Connected Fitness Subscription, versus 20.7 YOY
Q1 Average Net Monthly Connected Fitness Churn was 0.82%; as of Q1, 12-month retention rate was 92%
Q1 Gross Margin was 32.6%; Connected Fitness Product Gross Margin was 12.0%, Subscription Gross Margin was 66.7%, and Subscription Contribution Margin was 69.6%
Q1 Net Loss was $(376.0) million, $(1.25) per diluted share; Q1 Adjusted EBITDA was $(233.7) million, representing an Adjusted EBITDA Margin of (29.0)%
Outlook (lowered)
FY 2022 Q2:
2.8 million to 2.85 million ending Connected Fitness Subscriptions
$1.1 billion to $1.2 billion total revenue
Gross profit margin of approximately 24%
$(325) million to $(350) million Adjusted EBITDA
Updated Full FY 2022:
3.35 million to 3.45 million ending Connected Fitness Subscriptions
$4.4 billion to $4.8 billion total revenue
Gross profit margin of approximately 32%
$(425) million to $(475) million Adjusted EBITDA
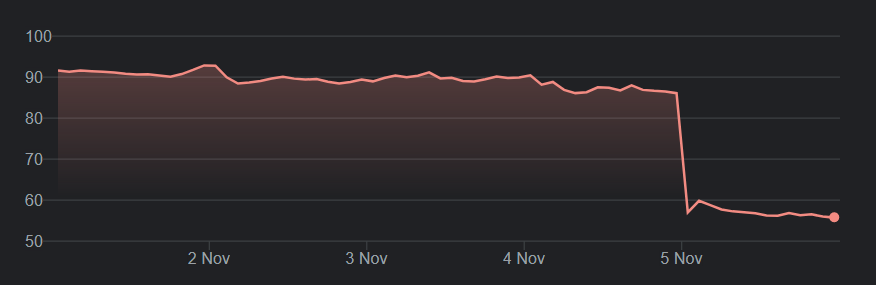
Stock ended the week down 39% (oops)
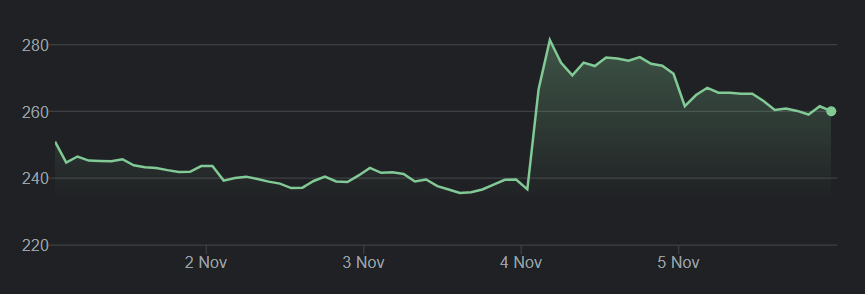
Airbnb
For report here
79.7 million nights and experiences booked, up 29 YOY and down 7% on a 2yr
$11.9 billion in Gross Booking Value (GBV), up 48% YOY and 23% on 2yr.
Revenue of $2.2 billion, up 67% YOY and 36% on 2yr.
Net income of $834 million, up 280% YOY and 213% on 2yr.
Adjusted EBITDA of $1.1 billion, up 120% YOY and 251% on 2yr.
Host earnings reached a record $12.8 billion in the quarter.
Outlook
As of the end of September, our backlog had over 40% more nights booked for Thanksgiving week in the U.S. than at the same time in 2019. And we are seeing the strong demand for travel extend well into 2022.
We expect to deliver Q4 revenue of between $1.39 billion and $1.48 billion, representing strong growth relative to both Q4 2020 and Q4 2019. Q4 revenue—in both absolute dollars and as a percentage of GBV—will decrease from Q3 due to travel seasonality
We expect our Q4 Adjusted EBITDA to show this continued progress, adjusted for seasonality. Specifically, we expect to deliver greater year-over-year and year-over-two year margin expansion in Q4 2021 than we delivered in Q3 2021.
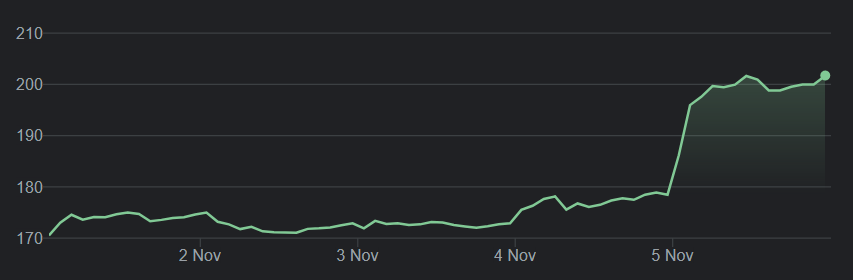
Stock ended the week up 18.2%
For report here and video here (will post the link to the recorded Space when it’s on Spotify)
The company reported Q3 revenue of $633 million, up 43% year over year (YOY). Global monthly active users (MAUs) grew just 1% YOY to 444 million.
US revenue grew 33% to $498 million and international revenue grew 96% to $135 million.
The company expects that Q4 revenue will grow in the high-teens percentage range year over year.
US MAUs decreased 10% to 89 million while international MAUs grew 4% to 356 million.
In 2022, Pinterest will enter three new Latin American markets as well as Japan. This will certainly boost engagement on the platform.
Average revenue per user (ARPU) keeps growing, but there's still so much potential in the monetization of international users. US ARPU grew 44% YOY, reaching $5.55, while international ARPU grew 81% to just $0.38.
The main reason international ARPU is still so low is that Pinterest doesn't monetize around 50% of those international markets.
Shopping on the platform is coming. The company is beta testing native checkout in Q4 with the likes of Shopify.
There were more positive signs with regards to shoppable Pins. The number of Pinners engaging with shopping surfaces was up more than 20% sequentially and up 60% YOY. Overall product searches were up over 100% from last year with searches on the Shop tab by Gen Z Pinners increasing over 200%. This to me shows the tremendous potential a platform like Pinterest has, not just for users and creators but for advertisers as well.
Stock ended the week up 3.8%

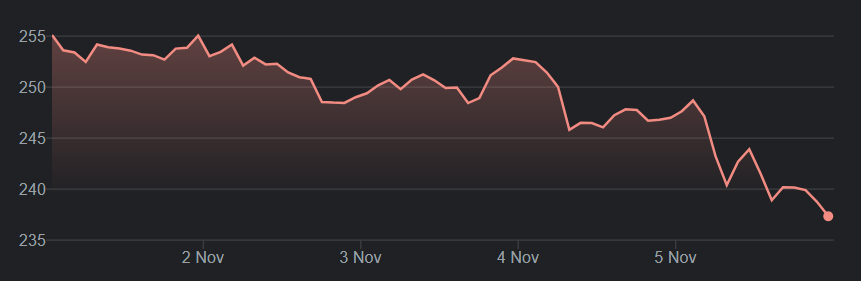
Redfin
For report here
Revenue increased 128% YOY to $540 million during the third quarter.
Gross profit was $127 million, an increase of 37% from $93 million in the third quarter of 2020.
Real estate services gross profit was $96 million, an increase of 5% from $92 million in the third quarter of 2020.
Real estate services gross margin was 37%, compared to 44% in the third quarter of 2020.
Operating expenses were $147 million, an increase of 163% from $56 million in the third quarter of 2020. Operating expenses were 27% of revenue, up from 24% in the third quarter of 2020.
Net loss was $18.9 million, compared to net loss of $34.2 million in the third quarter of 2020.
Net loss per share attributable to common stock, diluted, was $0.20, compared to net income per share attributable to common stock, diluted, of $0.30 in the third quarter of 2020.
Reached market share of 1.16% of U.S. existing home sales by value.
Outlook
Total revenue between $585 million and $606 million, representing a YOY increase between 139% and 148% compared to the fourth quarter of 2020. Included within total revenue are real estate services segment revenue between $225 million and $230 million, properties segment revenue between $319 million and $334 million, and rentals revenue between $38 million and $39 million.
Total net loss between $36 million and $31 million, compared to total net income of $14 million in the fourth quarter of 2020. RentPath's contribution to the net loss is expected to be approximately $15 million.
Stock ended the week down 3.4%

Mercadolibre
For report here
EPS $1.92 vs est $1.27
Revenues $1.86B vs est $1.86B up 72% YOY
$20.9 billion Total Payments Volume up 59% YOY
$7.3 billion GMV up 30% YOY
Unique Active Users at 80 million
Mercado Credito’s portfolio is now over $ 1.1 billion, almost 4x its size compared to the third quarter of 2020
Mercado Fondo, has now almost $919 million under management and approximately 20.7 million users across Latin America.
Mercado Envios shipped 247.8 million items during the quarter, up 32.1% YOY
Stock ended the week up 9.7%

Cloudflare
For report here
Total revenue totaled $172.3 million, representing an increase of 51% year-over-year
Strong large customer growth, with a record addition of roughly 170 large customers in the quarter, bringing the total number of large customers to 1,260
GAAP net loss of $107.3 million and non-GAAP net income of $1.4 million, with non-GAAP net income achieving milestone of break-even.
Something to keep in mind.
 $NET “Our strong growth & efficiency propelled us to reach profitability this q, year ahead of our timeline” Prince In Reality losses widened: GAAP Net LOSS = $107.3M vs $26.5 million Q3 20. Operating Cash flow= -$6.9M vs $2.0M Q3 ‘20. FCF= -$39.7M vs -$17.9M in Q3 20
Non-GAAP gross profit was $136.6 million, or 79.2% gross margin, compared to $88.2 million, or 77.3%, in Q3 2020.
For Q4 fiscal 2021
Total revenue of $184.0 to $185.0 million
Non-GAAP income (loss) from operations of $(1.0) to $0.0 million
Non-GAAP net income (loss) per share of $(0.01) to $0.00, utilizing weighted average common shares outstanding of approximately 320 million for a net loss per share, and approximately 345 million for a net income per share
For the FY fiscal 2021
Total revenue of $647.0 to $648.0 million
Non-GAAP loss from operations of $10.5 to $9.5 million
Non-GAAP net loss per share of $0.06 to $0.05, utilizing weighted average common shares outstanding of approximately 312 million
Stock ended the week up 1.29%
If you liked it please do share it! See you all next week!