


Earnings Week (7/26 - 7/30)
A week full of surprises

Hey reader!
This is the second edition of the earnings recap series(so bear with me). If you missed last week's recap you can read it here. And if you’d like, you can subscribe to my Youtube channel below.
This week has seen all of the big tech companies report earnings, and as you might have guessed, most beat estimates (by a lot). But that didn’t stop the market from turning red.
I’ll stop wasting your time now and get right into the companies.
Monday, July 26
TESLA 🚗
Full Q2 report here
Delivered units: 201,304
Revenue: $11.96B vs Est $11.36B up 98% YoY
Automotive sales of $10.2B up 97% YoY
Energy sales of $801M up 116% YoY
Bitcoin-related impairment of $23M
Automotive GM% : 28.4% (25.8% Ex Credits) up 3.0% YoY
Energy GM% : 2.5% 20m in profit
Total gross profit of $2.88B up 128% YoY
Net income GAAP of $1.14B up 920% GAAP EPS YoY
EPS $1.45 vs. Exp $0.97 up 233% YoY
Q2 FCF of $619M vs est -319M up 48% YoY
Tesla ended the quarter with $16.2b in cash and cash equivalents.
Outlook
No prediction of when 4680 will be ready for volume. The backup plan is non-structural and 2170.
Demand is not a problem, supply is. FSD progress is being made but the wide release will take time. No real insights on the subscriptions yet.
Tesla will open supercharger network to other manufacturers. Megapack sold out to end of next year. Chance of hitting 1 million powerwalls next year, 20k/week.
Texas and Berlin production will start in 2021. Semi-truck delayed until 2022.
Tesla ended the week up 5.59%

Tuesday, July 27
Starbucks ☕
Full report here
EPS: $1.01 vs. $0.77 est.
REVENUE: $7.5B vs. $7.23B est.
+5000 stores in China, global store count 33.295
24.2m active Starbucks reward membership in the US up 48% (Starbucks is more of a bank than a coffee shop)
Starbucks ended the week down 3.4%
Microsoft:
Full report here
Revenue: $46.2B beating expectations of $44.1B
EPS: $2.17 beating expectations of $1.9
Net income was $16.5 billion and increased 47%
Our commercial cloud revenue grew 36% year over year to $19.5 billion.”
Azure rev Q4FY21: $33B, +51%
Microsoft ended the week down 1.38%

Google:
Full report here
EPS: Q2 EPS $27.26 vs. $19.34 Est
Q2 Revs. $61.88B vs. $56.16B Est
Operating margin: 31%
Operating income: $19.3bln vs $6.3bln in 2020
Google ended the week up 1%

Teladoc:
Full report here
@StockMarketNerd summarized the print very well, you can find it here
Teladoc ended the week down 1.6%

Apple 🍎
Full report here
EPS $1.30 Beats $1.00 Estimate
Sales $81.40B Beat $72.93B Estimate up 36% YoY.
- 63.9bln product
- 17.4bln services
Q3 Sales To Americas Region $35.87B, Up From $27B YoY
Q3 European Sales $18.943B, Up From $14.173B YoY
Q3 Services Revenue $17.486B, Up From $13.156B YoY
Q3 Greater China Sales $14.762B, Up From $9.329B YoY
Q3 Japan Sales $6.364B, Up From $4.966B YoY
IPhone: $39.57B up 49.8% YoY
Mac: $8.24B up 16.38% YoY
IPad: $7.37B up 12% YoY
Wearables, Home, and Accessories: $8.78B up 36.12% YoY
Apple ended the week down 1.6%
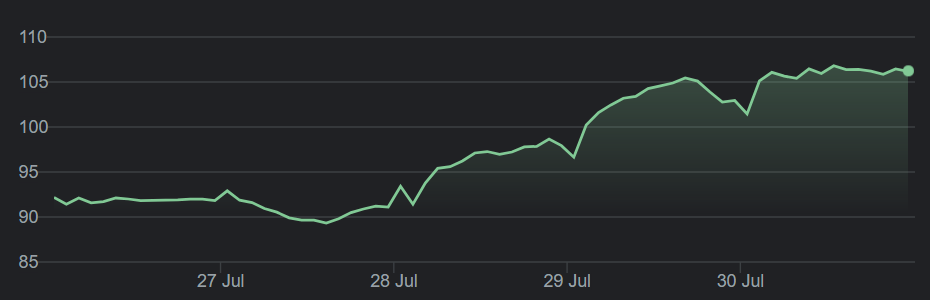
AMD 💽
Full report here
EPS $0.63 Beats $0.54 Estimate
Sales $3.85B Beat $3.62B Estimate
Gross margin 48%
Op income $831M; Non-GAAP $924M
Op margin 22%; Non-GAAP 24%
Net income $710M; Non-GAAP $778M
Operating cash flow $952M;
Record FCF $888M
Repurchased 3.2M shares of common stock for $256M
AMD ended the week up 15.2%!
Wednesday, July 28
Shopify 🛒
Full report here
filed a $10B shelf offering.
Rev $1.12bln up 57% YoY
- Subs solutions $334M up 70% YoY
- Merchant solutions $785M up 52% YoY
GMV for Q2: $42.2bln up 40% YoY
GPV $20.3bln up 45% YoY
Adj operating income: $236.8M up 16% YoY
Adj net income: $284.6M or $2.24 eps
$7.76 billion in cash, cash equiv.
Shopify ended the week down 9%

Spotify 🎶
Full report here
165M paid subs (top end of forecast)
365M MAUs (below guidance)
Podcast revenue was up over 627%
")
Outlook:
Q3:
Total MAUs: 377-382 million
Total Premium Subscribers: 170-174 million
Total Revenue: €2.31-€2.51 billion
Q4:
Total MAUs: 400-407 million
Total Premium Subscribers: 177-181 million
Total Revenue: €2.48-€2.68 billion
Spotify ended the week down 3.9%

Facebook:
Full report here
The metaverse was the center of attention during the call. It was also in Mark’s first remarks.
It’s safe to say that Facebook is very focused on investing in the metaverse or what the metaverse could be.

Revenue: $28.58B Beat $27.82B Estimate up 56% YoY
EPS: $3.61 Beats $3.02 Estimate up 101% YoY
Daily active users (DAUs) 1.91B vs est. 1.91B an increase of 7% YoY
Monthly active users (MAUs) 2.90B vs est. 2.90B an increase of 7% YoY
Family monthly active people (MAP) was 3.51 billion as of June 30, 2021, an increase of 12% YoY.
Operating margin up to 43% YoY from 32%
Net income up 101% YoY to over $10B (net income was up 100% YoY in Q2 of 2020 as well)
Outlook:
In the third and fourth quarters of 2021, we expect year-over-year total revenue growth rates to decelerate significantly on a sequential basis as we lap periods of increasingly strong growth. When viewing growth on a two-year basis to exclude the impacts from lapping the COVID-19 recovery, we expect year-over-two-year total revenue growth to decelerate modestly in the second half of 2021 compared to the second quarter growth rate.
We continue to expect increased ad targeting headwinds in 2021 from regulatory and platform changes, notably the recent iOS updates, which we expect to have a greater impact in the third quarter compared to the second quarter. This is factored into our outlook.

Facebook ended the week down 3.5%

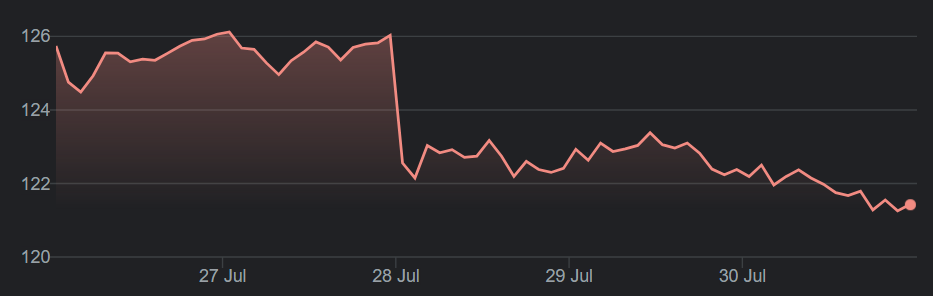
Paypal 💳
Full report here
Q2 EPS $1.15, vs est. $1.13
Revenue $6.24B vs est. $6.27B
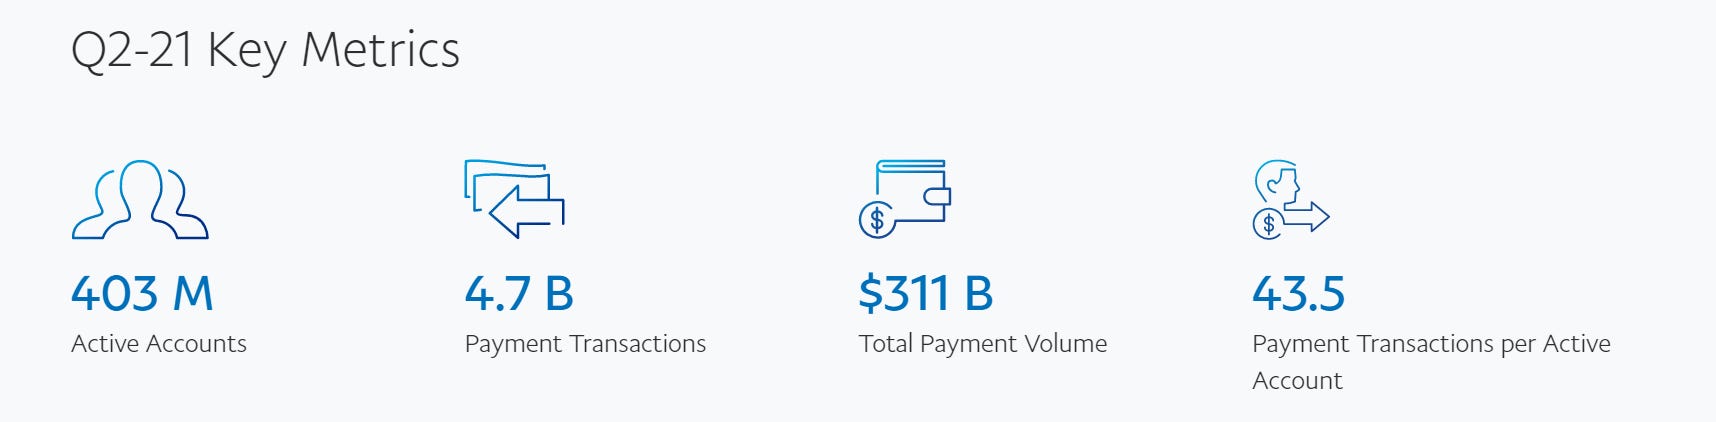
Venmo processed approximately $58 billion in TPV, growing 58%
Merchant Services volume grew 48% on a spot basis, and 43% FXN, representing 96% of TPV
eBay Marketplaces volume declined (37%) on a spot basis, and (41%) FXN, representing 4% of TPV, compared to 9% in the prior-year period
43.5 payment transactions per active account on a trailing twelve months basis, growing 11%
Outlook:
Q3 2021 EPS $1.07 vs est. $1.14
Q3 2021 revenue $6.15-6.25B vs est. $6.43B
FY2021 EPS $4.70 vs est. $4.73
FY2021 revenue $25.75B vs est. $25.88B
Paypal ended the week down 11%

Thursday, July 29
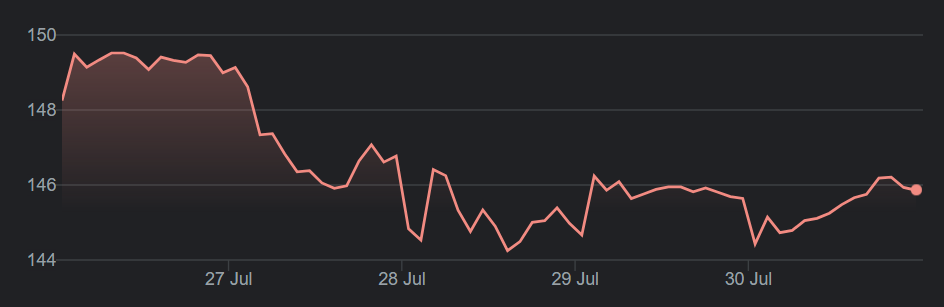
Amazon:
Full report here
Net sales $113.1B (+27% YoY) vs. $115.20B Est
Q2 EPS $15.12 vs. $12.30 Est.
Net income $7.8B, +50%
Low margin e-commerce sales growth slowing, but high-margin segments all crushing it:
AWS $14.8B, +37%
Advertising $7.9B, +83%
Subs $7.9B, +28%
Faster growing segments are now $56bln in Sales vs. slower at 57 bn.
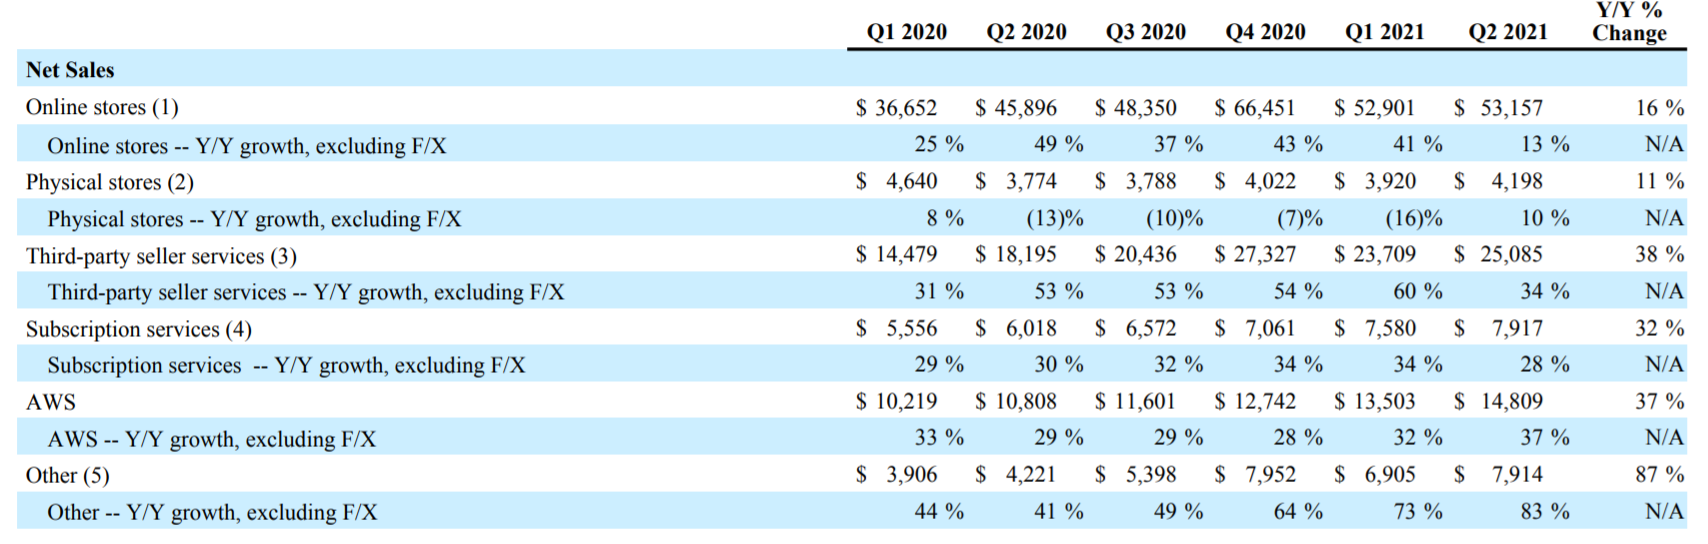
Amazon ended the week down 9.4%

Pinterest: 📌
Full report here and Youtube video here
Revenue up 125% YoY to $613 million and 26% QoQ
Q2 EPS $0.25, vs est. $0.13
Global MAU up 9% down 5% QoQ
US MAU down 5% YoY and 7% QoQ
International MAU up 13% but down 4.5% QoQARPU global up 89% 27% QoQ
ARPU US 103% YoY 27.32% QoQ
ARPU International up 163% YoY and 38% QoQ
Net income: $69.4M
Adjusted EBITDA: $178.2
Increase in revenue. More advertisers. Investment in shopping is working. In Q2, MAUs on our mobile apps grew in the U.S. year over year and grew by more than 20% internationally. Web users (least engaged audience) are responsible for the decline. Gen Z's audience grew double-digits YoY. Shopping engagement is more resilient than overall engagement
No guidance for Q3 MAUs, expecting revenue in the low 40% growth YoY
Pinners that save items to their shopping list are 7x more likely to buy things. Finally, the plan to pilot seamless on-platform transactions by the end of the year is on track.
Pinterest ended the week down 22.6%

That’s it for this week! If you liked it please do share it!