


Earnings week (8/23 - 8/27)
The end is near

Hey reader! 📰
First I would like to welcome the 47 new subscribers that signed up last week to the couch! You are joining the 397 couch investors! If you haven’t joined yet and would like to get an earnings summary each Saturday during each earnings season, you can sign up below for FREE.
This is the fifth edition of the earnings recap series. If you missed last week's recap you can read it here.
This week has seen some great and some not-so-great earnings. Some big misses and some big beats. But guess what? It doesn’t matter what the stock does, as long as the business is doing well.
A friendly reminder that the stock price reaction after earnings might have nothing to with how well/bad the company performed during the quarter.
If you have any companies that are reporting earnings next week and want them to be included, let me know in the comments. And if you’d like, you can subscribe to my Youtube channel below.
I’ll stop wasting your time now and get right into the companies.
Monday, August 23
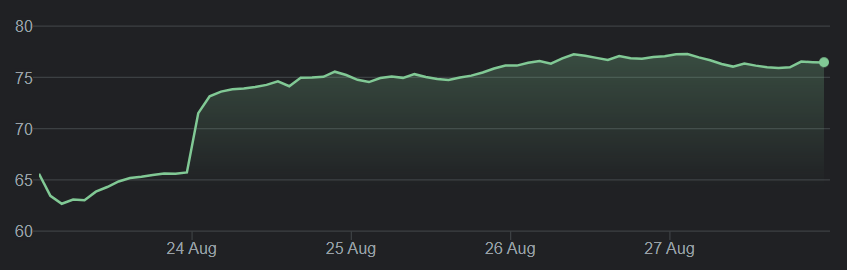
JD 🛒
Full report here
Revenue $39.3B up 37.9% YoY beats by $1.12B
EPS $0.45 beat by $0.11
As of June 30, 2021, JD Logistics operated approximately 1,200 warehouses, which covered an aggregate gross floor area of approximately 23 million square meters, including warehouse space of cloud warehouses managed under the JD Logistics Open Warehouse Platform.
As of June 30, 2021, JD Logistics had over 1,000 air cargo routes and the ability to utilize over 300 railway routes.
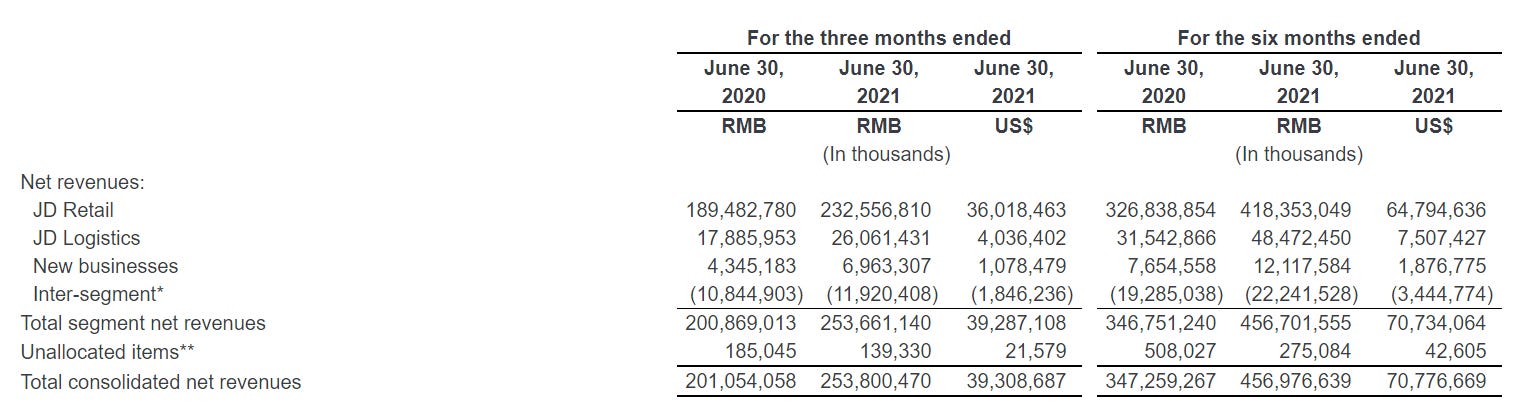
Net service revenue grew 49.2% YoY to 5.3 billion USD.
Annual active customers account grew by 27.4% YoY to 531.9 million
Stock ended the week 16.5%
Wednesday, August 25
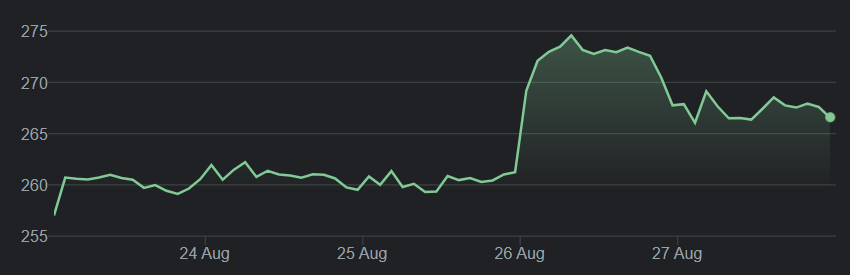
Salesforce
Full report here
“With companies and governments around the world continuing to accelerate their digital transformations, we delivered our fifth phenomenal quarter in a row,” - Marc Benioff, Chair & CEO, Salesforce.
Q2 EPS $1.48, vs est. $0.92
Revenue $6.34B vs est. $6.24B up 23% YOY
Subscription and support revenues for the quarter were $5.91 billion, an increase of 22% year-over-year.
Professional services and other revenues for the quarter were $0.43 billion, an increase of 37% year-over-year.
Current Remaining Performance Obligation of Approximately $18.7 Billion, up 23% YOY, 23% in Constant Currency
Second Quarter Operating Cash Flow of $0.39 Billion, down 10% YOY
Second Quarter GAAP Operating Margin of 5.2% and Non-GAAP Operating Margin of 20.4%
Outlook:
Q3 Revenue of $6.78 Billion to $6.79 Billion, up 25% YOY
FY22 revenue $26.2-26.3B vs est. $26.01B (includes contributions from Slack)
Stock ended the week up 3.7%
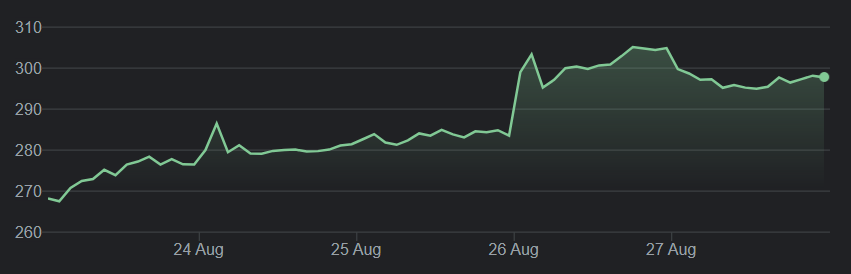
Snowflake ❄️
Full report here
Q2 EPS ($0.64) vs est. ($0.15)
Revenue $272.2mn up 104% YOY growth vs est. $256.54mn
Product revenue of $254.6 million, representing 103% YoY growth
Remaining performance obligations of $1.5B, representing 122% YoY growth
4,990 total customers
Net revenue retention rate of 169%
116 customers with trailing 12-month product revenue greater than $1mn
")
Outlook:
Q322 Product Revenue $280 - $285mn (89 - 92% YOY growth)
FY22 Product Revenue $1.06 - $1.07B (91 - 93% YOY growth)
Stock ended the week up 11%
Splunk
Full report here
Cloud ARR Up 72% Expects Total ARR of $3.1 Billion by Fiscal Year End
Cloud ARR was $976 million, up 72% YoY
Total ARR was $2.63 billion, up 37% YoY Cloud revenue was $217 million, up 73% YoY Total revenues were $606 million, up 23% YoY vs est. $562.82M
234 customers with Cloud ARR greater than $1 million, up 100% YoY
582 customers with Total ARR greater than $1 million, up 47% YoY
Q2 EPS ($0.33) vs est. ($0.69)
Outlook:
FY2022 revenue $2.53-2.6B vs est.$2.53B
Stock ended the week up 7%

Thursdays, August 26
Abercrombie 👚
Full report here
Total net sales grew 24% YOY to $865 million vs est $879m, or 3% from 2019.
EPS of $1.70 vs estimates $0.77.
Total global store sales rose 55% from last year and we're down 20% from 2019.
As customers returned to stores, digital net sales held steady to last year and remained highly penetrated, representing 44% of total second-quarter sales.
Gross margin rate improved 450 basis points as compared to last year to 65.2% driven by higher average unit retail on lower promotions.
Stock ended the week down 4.2%

Peloton 🚴♂️
Full report here
The company will no longer provide guidance on Average Net Monthly Connected Fitness Churn after this quarter, but we will continue to report this metric on a quarterly basis
Today, we announced our latest step in making Peloton more attainable by lowering the price of our original, award-winning Peloton Bike across all of our markets to $1,495 USD, or $39 per month with our 39-month financing plan.
Connected Fitness Subscriptions grew 114% to over 2.33 million and paid Digital Subscriptions grew 176% to over 874,000; total Members grew to over 5.9 million
Total revenue grew 54% to $937 million

Connected Fitness Subscription Workouts grew 75% to 134.3 million, averaging 19.9 Monthly Workouts per Connected Fitness Subscription, versus 24.7 in the year-ago period
Q4 Average Net Monthly Connected Fitness Churn was 0.73%; as of Q4, 12-month retention rate was 92%
Q4 Gross Margin was 27.1%;
Connected Fitness Product Gross Margin was 11.6%
Subscription Gross Margin was 63.3%, and Subscription Contribution Margin was 69.3%

Outlook:
Q1 guidance:
2.47 million ending Connected Fitness Subscriptions
Average Net Monthly Connected Fitness Churn of approximately 0.85%
$800 million total revenue
Gross profit margin of approximately 33%
$(285) million Adjusted EBITDA
Full Year FY 2022 guidance:
3.63 million ending Connected Fitness Subscriptions
$5.4 billion total revenue
Gross profit margin of approximately 34%
$(325) million Adjusted EBITDA, (6.0)% Adjusted EBITDA Margin
Stock ended the down 1.2%

Gap 👖
Full report here
Net sales of $4.2 billion were the highest second-quarter sales in over a decade, up 29% versus 2020 and up 5% compared to 2019.
Q2 comparable sales increased 12% versus 2019
EPS of $0.67 vs estimated $0.45
Gross profit: $1.82 billion, an increase of $267 million or 17%.
Gross margin: 43.3%, an increase of 440 basis points
Outlook
Raising full-year outlook for sales, operating margin, and earnings per share
Sales growth of about thirty percent versus 2020
Reported operating margin of about 7.0%
Adjusted operating margin of about 7.5%
Reported earnings per share range of $1.90 - $2.05
Adjusted earnings per share range of $2.10 - $2.25
Stock ended the week down 7.6%


It’s been a pleasure doing this. I hope to see you all in 3 months for the next round of earnings!
- Couch