


Earnings week (8/9 - 8/13)
Another packed week behind the week!

Hey reader! 📰
This is the third edition of the earnings recap series. If you missed last week's recap you can read it here. And if you’d like, you can subscribe to my Youtube channel below. Unity, Coinbase and Disney were covered on the channel.
This week has seen some great and some not-so-great earnings. Some big misses and some big beats. But guess what? It doesn’t matter what the stock does, as long as the business is doing well.
A friendly reminder that the stock price reaction after earnings might have nothing to with how well/bad the company performed during the quarter.
If you have any companies that are reporting earnings next week and want them to be included, let me know in the comments.
I’ll stop wasting your time now and get right into the companies.
Monday, August 9
The Trade Desk 📺
Full report here
Revenue of $280M vs $262M est up 101% YoY
Adj EBITDA $117.9M vs $87.3M est
Adj EBITDA Margin 42% compared to 10% in 2020
Adj EPS $0.18 vs $0.13 est
Customer retention remained over 95% during the quarter, as it has for the previous 7 years!
Outlook
Revenue of $282M vs $275.3M
Adj Ebitda $100M vs $89.4M est
Brad (@StockMarketnerd) covered it very nicely here
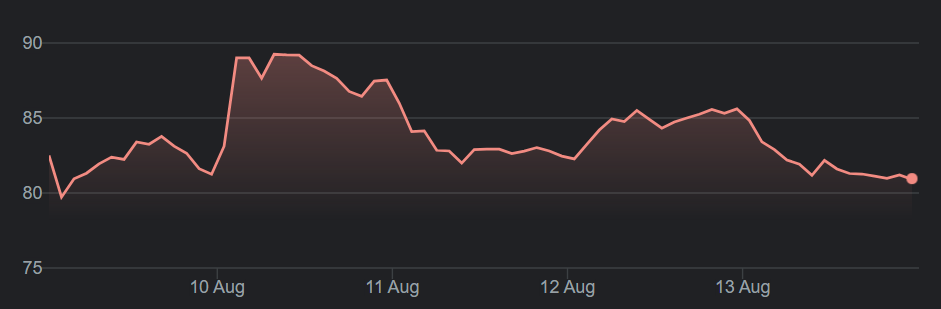
Stock ended the week down 1.9%
Tuesday, August 10
Unity 🕹️
Full report here and video here
The company reported revenue of $273.6 million, up 48% year over year.
This is divided into three revenue sources:
Create solutions segment, which came in at $72.4 million, up 31% year over year (YOY);
Operate solutions segment, with revenue of $182.9 million, up 63% YOY;
Strategic partnerships and other, with revenue of $18.3 million, up 9% YOY. Customers that generate more than $100,000 of revenue per year reached 888, up from 716 last year. The dollar-based net expansion rate (DBNR) stayed flat at 142%.
Unity raised guidance by another $45 million for the full year. It raised full-year guidance in the first quarter as well, by $50 million.
Stock ended the week up 19.39%
Coinbase ₿
Full report here and video here
“We want to be the Amazon of assets, list every asset out there in crypto that’s legal. There are thousands of them today. There are eventually going to be millions of them. This is all under the theme of embracing decentralization.” - Brian Armstrong
Coinbase reported earnings per share of $6.42, beating expectations of $2.57, and revenue of $2.23 billion, beating expectations of $1.83 billion. Net income was $1.6 billion and adjusted EBITDA was $1.1 billion.
The company said it now has over 9,000 financial institutions using Coinbase, and retail monthly transacting users (MTUs) stood at 8.8 million, up 44% quarter over quarter, while "verified users" on the platform were 68 million.
Outlook
Coinbase expects retail MTUs and total trading volume to be lower in Q3 because of the uncertainty in the market, and volatility might go down as more people go on vacation and trade less. For the full year, the company envisioned three possible scenarios: high (average MTUs of 8.0 million), mid (average MTUs of 7.0 million), and low (average MTUs of 5.5 million).
Stock ended the week down 2.52%
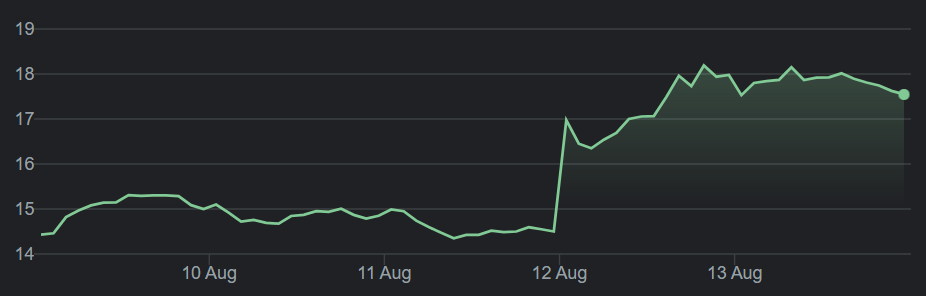
Upstart 💸
Full report here
Revenue $194M +1,018% YoY
Non-GAAP EPS, 0.62 beats by $0.37.
GAAP EPS of $0.39 beats by $0.27
Loans: $2.80B, +1,605%
Conversion 24% vs. 9% in Q2 2020
Operating income: $36.3M vs ($11.4M) in Q2 2020
Outlook
Q3
Revenue of $205 to $215 million
Contribution Margin of approximately 45%
Net Income of $18 to $22 million
Adjusted Net Income of $28 to $32 million
Adjusted EBITDA of $30 to $34 million
FY21
Revenue of $750 million (vs prior guidance of $600 million)
Contribution Margin of 45% (vs prior guidance of 42%)
Adjusted EBITDA Margin of 17% (vs prior guidance of 10%)
Brad (@StockMarketnerd) covered it as well here
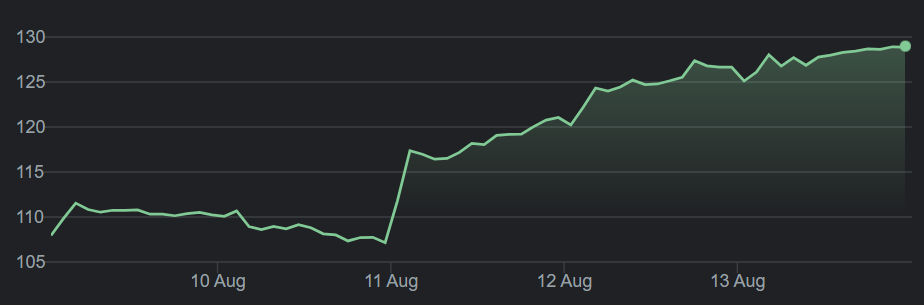
Stock ended the week up 50%!!!! 🚀
Nanox 🦴
Full report here
Brad (@StockMarketnerd) covered it very nicely here
Stock ended the week down 10.79%

Wednesday, August 11
Wix 🖥️
Full report here
EPS(0.28) vs est ($0.41)
Q2'21 revenue of $316 million, up 34% YoY est $311.64M
Q2'21 Collections of $343 million, up 29% YoY
Online commerce accounted for 35% of Q2'21 total collections, up from 33% in Q1'21. Business Solutions Revenue and Collections up 75% YoY and 66% YoY respectively.
Announced significant partnership with Vistaprint, becoming the technology layer for millions of Vistaprint customers globally.
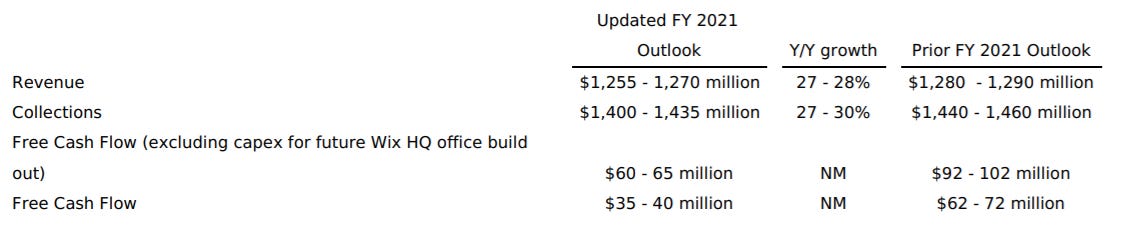
Outlook (lowered FY21 guidance)
Q3 Revenue $311 - 317 million 22 - 25% YoY
Q3 Collections $355 - 365 million 26 - 30% YoY
FY21
A day after ER, Wix launches a no-code app builder for $200 per month

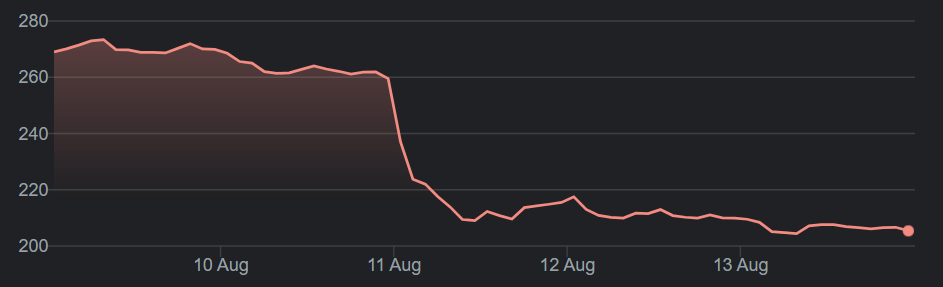
Stock ended the week down 23.60%
NIO 🚗
Full report here
EPS ($0.03) vs. ($0.11)
Revenues: $1.31 billion vs. $1.28 billion (+127% YoY)
Vehicle sales were $1,2 billion up 127.0% from Q2 2020 and up 6.8% from Q1 2021.
Vehicle margin: 20.3% vs. 9.7% in 2020
Gross profit: $244 million 402% YoY
Deliveries of vehicles were 21,896 in the second quarter of 2021, including 4,433 ES8s, 9,935 ES6s and 7,528 EC6s, up 111.9% from Q2 2020 and an increase of 9.2% from Q1 2021.
NIO delivered 7,931 vehicles in July 2021, representing a strong 124.5% YoY growth. As of July 31, 2021, cumulative deliveries of the ES8, ES6 and EC6 reached 125,528 vehicles.
Outlook Q3
Deliveries of the vehicles to be between 23,000 and 25,000 vehicles, representing an increase of approximately 88.4% to 104.8% from the same quarter of 2020, and an increase of approximately 5.0% to 14.2% from the second quarter of 2021.
Total revenues to be between $1.38 billion & $1.49 billion, representing an increase of approximately 96.9% to 112.8% from the same quarter of 2020, and an increase of approximately 5.5% to 14.0% from the second quarter of 2021.
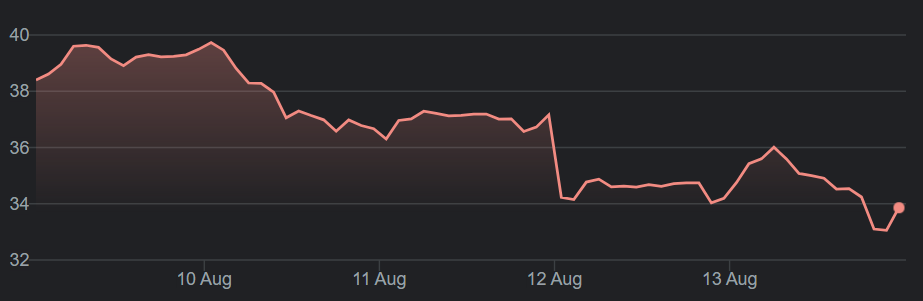
Stock ended the week down 6.11%
Coupang 🛒
Full report here
15th consecutive Q of over 50% constant-currency revenue growth.
Revenue growing at a multiple of the Korean e-com segment, reaching $18B run-rate.
Q2 EPS ($0.30) vs est. ($0.14)
Revenue $4.48B up 71% YoY vs est. $4.47B
Total Active Customers increased 26% YoY to 17 million and Revenue per Active Customer grew 36% YoY.
Gross Profit was $658 million in Q2, up 50% YoY. Excl $158 million in inventory write-offs related to the fire at the fulfillment center in Deokpyeong, Korea (“FC Fire”).
Gross Profit increased 86% YoY to a record $816 million.
🥕Fresh revenue grew over 100% YoY exceeding $2 billion run-rate and the contribution margin improved by nearly a 1000 basis points YoY.
🍅Eats revenue nearly tripled over just the past two quarters and the loss per order was down over 50% YoY.
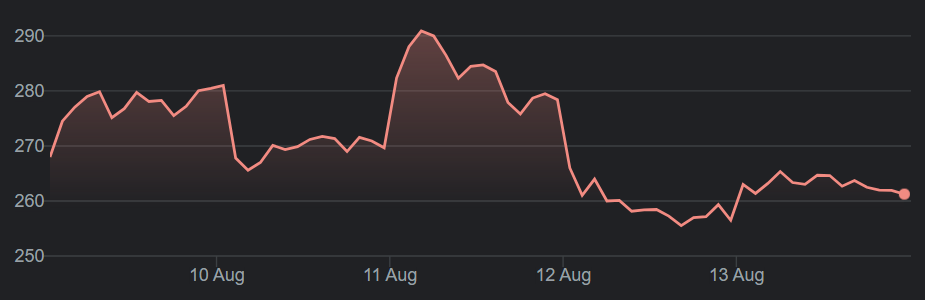
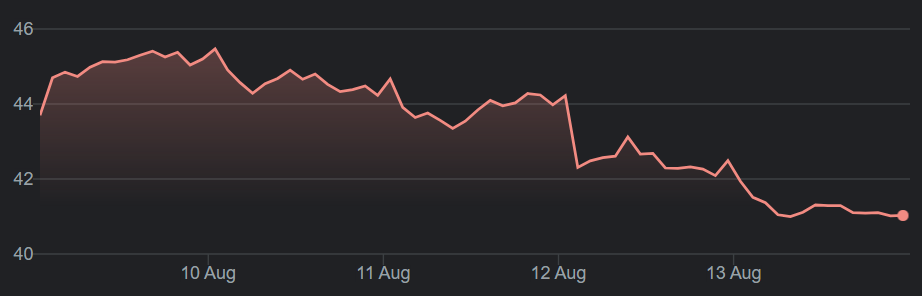
Stock ended the week down 11.80%
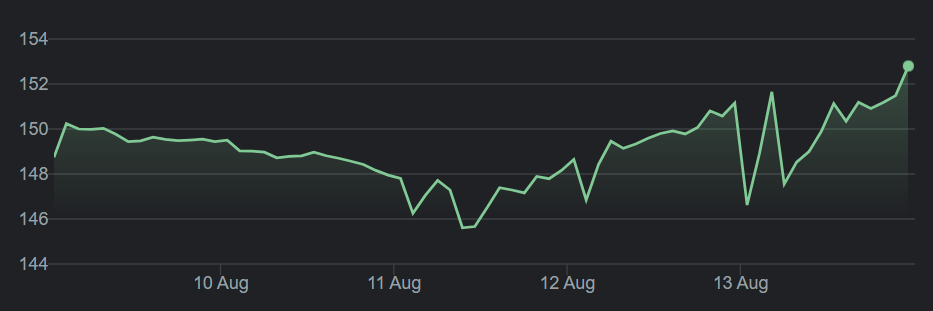
Opendoor 🏘️
Full report here
Q2 EPS ($0.24) vs est. ($0.34)
Revenue of $1.2 billion, up 59% QoQ, with 3,481 total homes sold, up 41% up QoQ.
Gross profit of $159 million, up 64% QoQ.
Gross margin of 13.4%, up 40 basis points QoQ.
Net income of ($144) million, versus ($270) million in Q1
Adjusted net income of $2.5 million versus adjusted net income of ($21) million in Q1
Expanded to 39 markets at the end of Q2 with 12 new market launches
Purchased 8,494 homes, up 136% versus Q1
Grew inventory balance to $2.7 billion, up 224% versus Q1
Ended the quarter with contracts to acquire 8,158 homes, representing $3.0 billion in value
Outlook
Q3 revenue guidance of $1.8 billion - $1.9 billion
Q3 adjusted EBITDA guidance of $15 million - $25 million
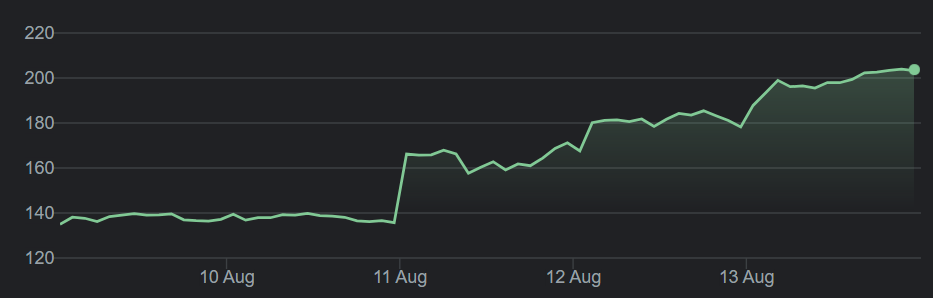
Stock ended the week up 21.60%
Thursday, August 12
Palantir 🔮
Full report here
Q2 EPS $0.04 vs est. $0.03
Revenue $376m up 49% YoY vs est. $353.23m
US commercial revenue grew 90% YoY
Added 20 net new customers in Q2 increasing its total customers by 13% QoQ
In Q2 it closed 62 deals of $1M or more, of which:
30 deals of $5M or more
21 deals of $10M or more
Outlook:
Q3 revenue $385m vs est. 376.4m
Adjusted operating margin of 22%
FY2021 guidance raised.
Adjusted free cash flow to in excess of $300 million, up from in excess of $150 million.
Annual revenue growth of 30% or greater for 2021 through 2025.
Stock ended the week up 14%

Disney 🐭
Full report here and video here
Q3 revenue of $17 billion, up 45% year over year, and earnings per share of $0.80, beating estimates of $0.55. Disney's revenue sources are divided into two streams. Media and entertainment distribution came in at $12.68 billion, up 18% year over year, and parks, experiences and products came in at $4.34 billion, up over 100% YOY.
Disney+ reached a record 116 million paid subscribers, up over 100% YOY.
ESPN+ and Hulu grew their subscriber bases 75% and 21% respectively.
In total, Disney's streaming services now have 173 million subscribers.
Disney announced a Disney+ Day on November 12. CEO Bob Chapek said, "November 12 will be Disney+ Day, which will be an unprecedented cross-promotional campaign."
Management also said that churn rates for Disney+ are declining and retention is very healthy, and it said that Disney will be implementing new guest services technology, including the "Disney Genie," "Magic Key," and more. This will help visitors get the most out of their experiences.
The company also expects both dividends and share repurchases to return in the future, "but not until we have returned to a more normalized operating environment."
Stock ended the week up 2.3%

Airbnb 🛏️🍩
Full report here
“We’re proud of our strong results this quarter, which again surpassed 2019 revenue levels. Travel is different than before, and because of our adaptable business model and continued product innovation to meet the changing needs of our guests, Airbnb is leading the travel rebound.” - Brian Chesky
Revenue: $1.34 billion +299% YoY and +10% based on Q2 2019
Net Loss: $68 million vs $576 million YoY
Gross Booking Value: $13.4 billion +320% YoY and 37% from Q2 2019
Nights & experiences booked: 83.1 million + 197% YoY
Free cashflow $784 million
Outlook
“We expect Q3 2021 revenue to be our strongest quarterly revenue on record and to deliver the highest Adjusted EBITDA dollars and margin ever”
I spoke about all the new Airbnb updates and potential of it for the long term here
Stock ended the week up 2.7%
That’s it for this week! If you liked it please do share it! See you all next week!