


Earnings Week Nov. 20 - Nov. 23 (Happy Thanksgiving)
Nvidia, dLocal, Deere & Company, Zoom, Autodesk & Lowe's

Hey reader! 📰
If you’re new here, welcome and if not, welcome back! If you haven’t joined the 775 subscribed members yet and want an earnings summary each Saturday during each earnings season, you can sign up below for FREE (thank you to my paid subscribers!). And consider subscribing to the YouTube channel.
A friendly reminder that the stock price reaction after earnings might have nothing to do with how well/bad the company performed during the quarter.


Try Seeking Alpha’s Premium Membership HERE
Zoom
For the transcript and press release click HERE
Q3 Non-GAAP EPS of $1.29 beats by $0.21.
Revenue of $1.14B (+3.6% Y/Y) beats by $20M.
Third quarter Enterprise revenue of $660.6 million, up 7.5% year over year
Third quarter GAAP operating margin of 14.9% and non-GAAP operating margin of 39.3%
Third quarter operating cash flow of $493.2 million, up 67.0% year over year
Number of customers contributing more than $100,000 in trailing 12 months revenue up 13.5% year over year.
Approximately 219,700 Enterprise customers, up 5.0% from the same quarter last fiscal year.
A trailing 12-month net dollar expansion rate for Enterprise customers of 105%.
3,731 customers contributing more than $100,000 in trailing 12 months revenue, up approximately 13.5% from the same quarter last fiscal year.
Online average monthly churn of 3.0% for the third quarter, down 10 bps from the same quarter last fiscal year.
The percentage of total Online MRR from Online customers with a continual term of service of at least 16 months was 73.2%, up 250 bps year over year.
Q4 Outlook: Total revenue is expected to be between $1.125 billion and $1.130 billion vs. consensus of $1.13B and revenue in constant currency is expected to be between $1.129 billion and $1.134 billion.
Non-GAAP income from operations is expected to be between $409.0 million and $414.0 million.
Non-GAAP diluted EPS is expected to be between $1.13 and $1.15 vs. consensus of $1.08.
2024 Outlook: Total revenue is expected to be between $4.506 billion and $4.511 billion vs. consensus of $4.50B and revenue in constant currency is expected to be between $4.542 billion and $4.547 billion.
Full fiscal year non-GAAP income from operations is expected to be between $1.740 billion and $1.745 billion. Full fiscal year non-GAAP diluted EPS is expected to be between $4.93 and $4.95 vs. consensus of $4.66.
Nvidia
For the transcript and press release click HERE
I’ve also covered it on my channel in detail.
3 Non-GAAP EPS of $4.02 beats by $0.63.
Revenue of $18.12B (+205.6% Y/Y) beats by $2.01B.
Record Data Center revenue of $14.51 billion, up 41% from Q2, up 279% from year ago
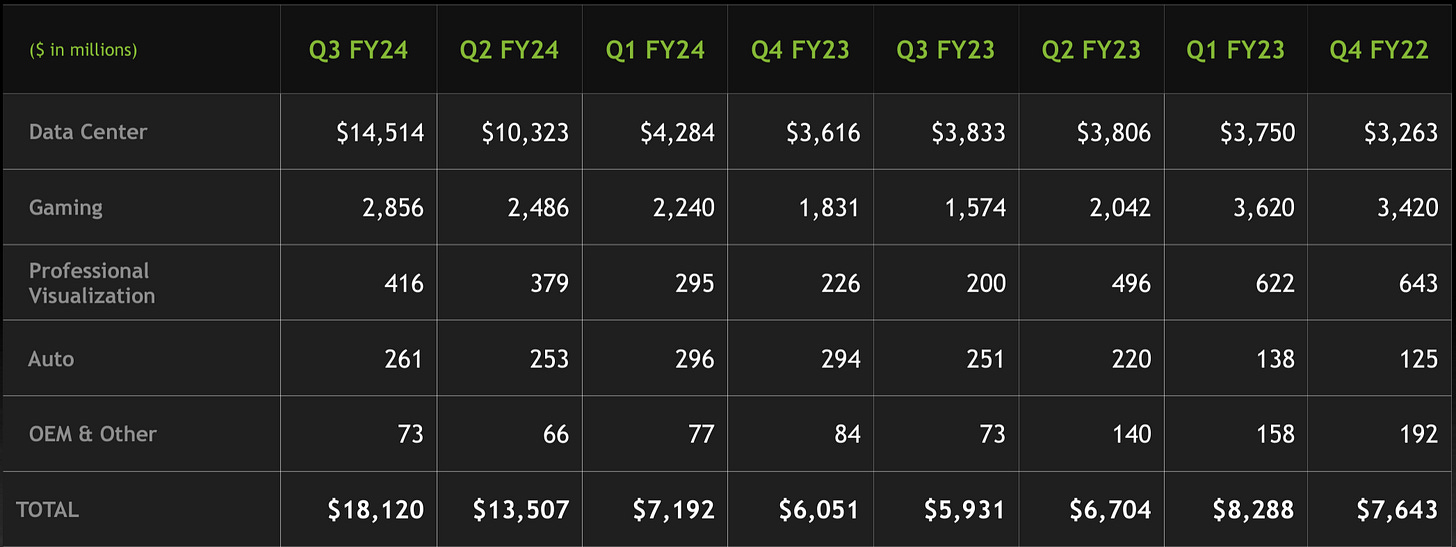
Nvidia quarterly revenue trend Q4 Guidance:
Revenue is expected to be $20.00 billion, plus or minus 2% vs $17.82B consensus
GAAP and non-GAAP gross margins are expected to be 74.5% and 75.5%, respectively, plus or minus 50 basis points.

dLocal
For the transcript and press release click HERE
I’ve also covered it on my channel in detail.
Q3 GAAP EPS of $0.13 misses by $0.02.
Revenue of $164M (+46.6% Y/Y) misses by $2.18M.
We reaffirm our guidance for the year of revenue between US$620 and US$640 million and Adjusted EBITDA between US$200 and US$220 million.
We have not modified our mid-term guidance of 25%-35% gross profit CAGR and Adjusted EBITDA over gross profit >75%, the company said.
FY23 consensus revenue estimate is $643.65M.
Deere & Company
For the transcript and press release click HERE
Q4 GAAP EPS of $8.26 beats by $0.85.
Revenue of $15.41B (-0.8% Y/Y) beats by $1.75B.
Net income attributable to Deere & Company for fiscal 2024 is forecasted to be in a range of $7.75 billion to $8.25 billion.
The company forecast net income of $7.75 billion to $8.25 billion in fiscal-year 2024, down from $10.17 billion in 2023, as sales volumes "return to mid-cycle levels.”
This Stock OUTPERFORMED the FAANG
Lowe’s
For the transcript and press release click HERE
Q3 GAAP EPS of $3.06 beats by $0.04.
Revenue of $20.47B (-12.8% Y/Y) misses by $390M.
Comparable sales decreased 7.4% due to a decline in DIY discretionary spending, partially offset by positive Pro customer comp sales.
Full Year 2023 Outlook – a 52-week year (comparisons to full year 2022 – a 53-week year)
Total sales of approximately $86 billion (previously $87 – $89 billion)
Comparable sales expected to be down approximately -5% as compared to prior year (previously down -2% to -4%)
Adjusted operating income as a percentage of sales (adjusted operating margin) of approximately 13.3% (previously 13.4% to 13.6%)
Interest expense of approximately $1.4 billion (previously $1.5 billion)
Adjusted effective income tax rate of approximately 25%
Adjusted diluted earnings per share of approximately $13.00 (previously $13.20 to $13.60)
Autodesk
For the transcript and press release click HERE
Q3 Non-GAAP EPS of $2.07 beats by $0.08.
Revenue of $1.41B (+10.2% Y/Y) beats by $20M.
Current remaining performance obligations were $3.5 billion, up 12 percent year over year.
Non-GAAP operating margin was 39 percent, up 3 percentage points.
Total billings decreased 11 percent to $1,204 million.
Q4 Outlook: Revenue $1,422 - $1,437M vs. consensus of $1.43B; EPS non-GAAP $1.91 - $1.97 vs. consensus of $2.00.
2024 Outlook: Billings $5,075 - $5,175M, Down 12% - 11%; Revenue $5,450 - $5,465M vs. consensus of $5.44B, Up approx. 9%; Non-GAAP operating margin Approx. flat year over year; EPS non-GAAP $7.43 - $7.49 vs. consensus of $7.47.
