


Earnings week (8/2 - 8/6)
Another volatile earnings week with some big surprises.

Hey reader!
This is the second edition of the earnings recap series. If you missed last week's recap you can read it here. And if you’d like, you can subscribe to my Youtube channel below. SQ, LMND & FVRR earnings reports were covered on the channel.
This week has seen some great and some not-so-great earnings. Some big misses and some big beats. But guess what? Most went red anyways. A friendly reminder that the stock price reaction after earnings might have nothing to with how well/bad the company performed during the quarter.
I’ll stop wasting your time now and get right into the companies.
Monday, August 2
Square 🏦
Full report here and video here and Afterpay acquisition here
Square is acquiring Australian BNPL company Afterpay for $29bln to be paid in all stock!
Rev: $4.68B up 143% YoY vs EST $5.05B
- ex BTC Rev $1.96B up 87% YoY
EPS: $0.66 up 267% vs EST $0.31
Gross Profit: $1.14B up 91% YoY vs EST $1.09B
- Cash App GP: $546m up 94% YoY
- Seller GP: $585m up up 85% YoY
EBITDA: $360M up 268% vs EST $176M
Net Income: $204M up from (11M) loss Q2 20
Stock ended the week up 10.9%

Tuesday, August 3
Alibaba
Full report here
Q1 EPS $2.57 vs est. $2.24
Revenue $31.87B vs est. $32.54B up 34% YoY
- Commerce up 35% to $27.9bln
- International commerce retail up 54% to $1.7bln
- Cainiao up 50% to $1.8bln
- Cloud revenue of $2.48bln up 29%
Annual active consumers across the Alibaba Ecosystem reached 1.18 billion, incl 912m consumers in China.
Annual active consumers of Taobao Deals grew to over 190 million.
Lazada order growth up 90%
Taobao Grocery and Freshippo have seen 200% QoQ GMV Growth.
Board authorized upsized share repurchase program from US$10B to US$15B
Stock ended the week flat
Corsair 🎮
Full report here
EPS: $0.36 vs $0.39est (MISS)
Rev: $472.9M, up 24.3% YoY vs $475.16M est (MISS)
Gross profit: $130.4 million, up 24.1% YoY, with gross margin of 27.6%, flat YoY
Adjusted operating income was $49.3 million, up 3.9% YoY.
Adjusted net income was $35.7 million
Outlook

The second half of the year is usually better for Corsair as we move into holiday territory, upgrade of gaming equipment, new DDR5, etc…
They have also launched their first camera “which has received an overwhelmingly positive response from the creator community”.
So far this year, Corsair has launched 75 new products. Demand is not an issue, supply is.
Stock ended the week down 5%

Activision 🎮
Full report here

EPS $0.91 vs est $
Activision: Net Rev of $789m, 46% operating margin. 127m MAUs
Blizzard: Net Rev of $433m, 33% operating margin. 26m MAUs
King: Net Rev of $635m, 39% operating margin. 255m MAUs
Raised full-year revenue forecasts.

Stock ended the week down 1.8%

Wednesday, August 4
ROKU 📺
Full report here
Q2:
EPS $0.52 vs est. $0.12
Total net revenue grew 81% year-over-year (YoY) to $645 million
Platform revenue increased 117% YoY to $532 million
Gross profit was up 130% YoY to $338 million
Active Accounts reached 55.1 million, up 1.5 million active accounts from Q1 2021
Streaming hours were 17.4 billion hours, down 1.0 billion hours from Q1 2021
Average Revenue Per User (ARPU) grew to $36.46 (TTM basis), up 46% YoY
Outlook

Stock ended the week down 9.4%
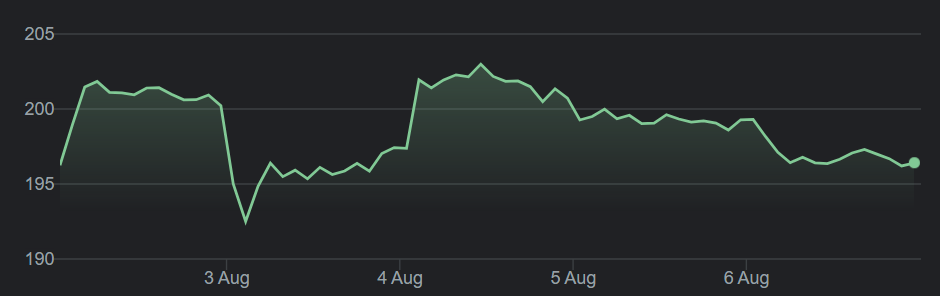
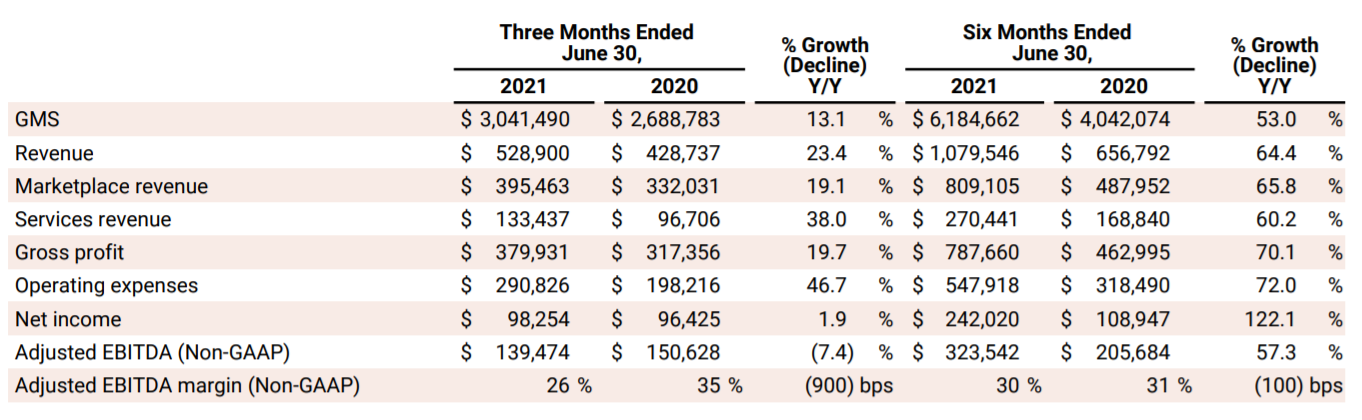
Etsy 🧶
Full report here
Revenue: $528.9M (beat) EPS: $0.68 (beat)

Outlook
Q3 revenue $500-$525M compared to analysts estimates $525M. 13.5% YoY at the midpoint.
GMS: $2.9bln-$3bln — 12.5% YoY growth at the midpoint
Stock ended the week down 4.1%

Fastly 💨
Full report here
Revenue: $85M (miss $85.7) up 14% YoY
EPS: (0.15) beats (0.17)
Non-Gaap gross margin 57.6%, down from 61.7% Q2 20
DBNER of 126% compared to 141% in Q1 21 (Including SS)
Total customer count increased to 2,581 from 2,4585 in Q1 2021
- Enterprise customer count of 408, up from 3955 in Q1 2021 (Including SS)
Average enterprise customer spend of approximately $702,000, essentially flat from $705,0005 in Q1 2021 (Including SS)
Enterprise customers generated 89% of our trailing twelve-month total revenue, in both Q1 and Q2 2021 (Including SS)
Outage!
95% of the network returned to normal within 49 minutes. Traffic decreased and credits were issued. This has negatively impacted the quarter but it will also impact Q3 and full year.
A top 10 customer still has not returned with traffic. Several launches have been delayed as well.
Outlook

Stock ended the week down 14%

Lemonade 🍋
Full report here and video here
In Force Premium (IFP) $297m up 91% YoY
Premium per Customer $246 up 29 YoY
Total Customers 1,206,172 up 48% YoY
Gross Earned Premium $67m up 90% YoY
Gross Loss Ratio 74% (still feeling the effect of the Texas Freeze)

New reinsurance agreement: A reduction in the scope of the quota share program - stepping down from 75% to 70%. This will positively impact the business.
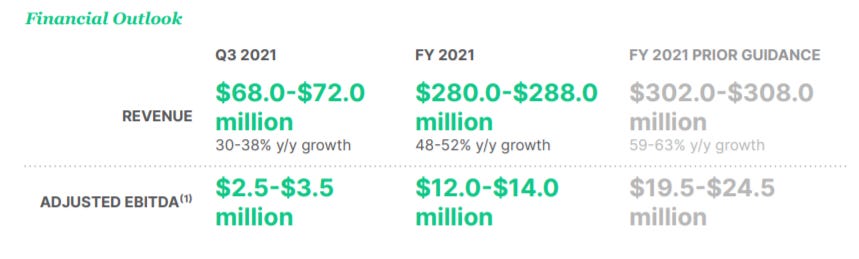
Outlook
Q3
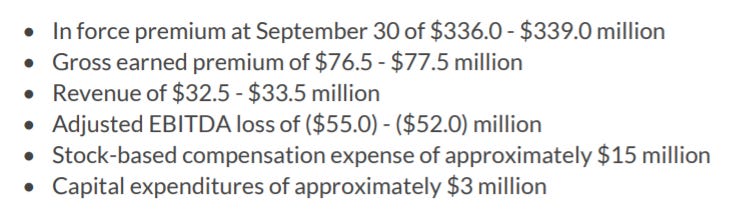
FY21

Stock ended the week down 8%

Mercadolibre 🛍️
Full report here
Net Rev of $1.7B up 102.6% YoY on an FX neutral basis
$17.5B TPV, 72% YoY on an FX neutral basis
$7.0B GMV, of 39.2% in USD, 46% YoY on an FX neutral basis
Unique active users grew by 47.4% YoY, to 75.9M.
Mobile GMV grew by 218.2% YoY on an FX neutral basis, reaching 73.4% of GMV.
Net income was $68.2 million, resulting in net income per share of $1.37.
Mercado Envios shipped 230.5 million items during the quarter, up 46.4% YoY.
Total payment volume (“TPV”) through Mercado Pago surpassed $17.5 billion, up 56.3% YoY and 72.2% on an FX neutral basis.
Total payment transactions increased 80.3% YoY, totaling 729.9 million transactions for the quarter.

Asset management product, Mercado Fondo, has >$810M under management & 19.3M users in LATAM.
I have no idea why I don’t own this incredible company..
Stock ended the week up 10%

Thursday, August 5
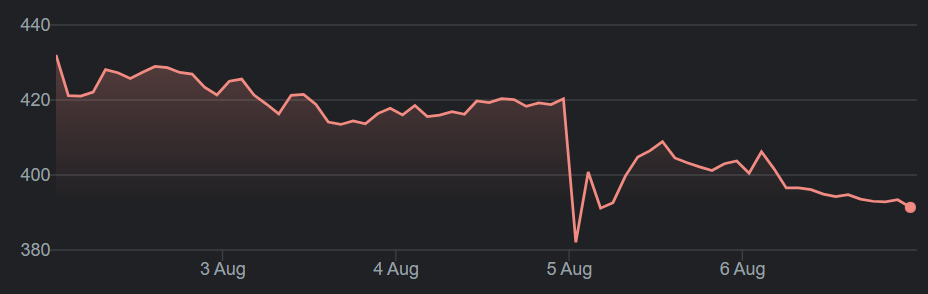
Fiverr 🕔
Full report here and video here
EPS of $0.19 beating by $0.05
Revenue $75.26M, up 59.7% YoY, beats by $0.44M.
Active buyers: 4.0 million +43% YoY
Spend per buyer: $226 +23% YoY
Take rate: 27.8% up from 27.0% YoY
Gross margin: 83.4% up from 83.1% YoY
Fiverr Business now accounts for 5% of core marketplace business
Outlook (the main reason why the stock is down)
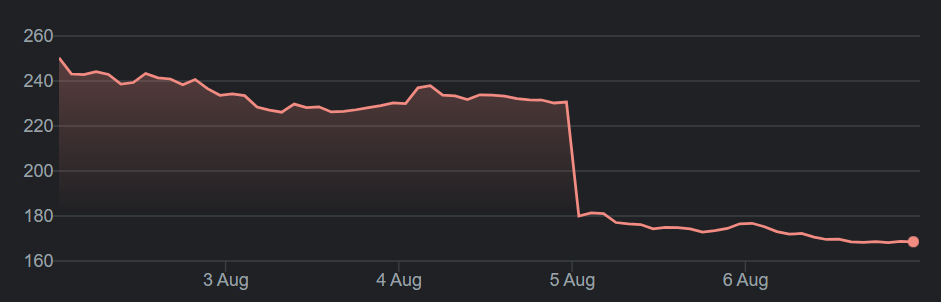
Stock ended the week down 32%!
Cloudflare ☁️
Full report here
Revenue: $152.4 million +53% YoY (consensus estimate was $146 million)
Net loss: $35.5 million compared to $26.1 million YoY
Dollar-based net retention rate: 124%
Large customers: 1,088 +140 additions a record in a single quarter
Outlook
Q3 21 revenue of $165 million
FY21 revenue of $631 million up from $614 million
Stock ended the week down 0.3%
Redfin 🏘️
Full report here
GAAP EPS of ($0.29) beats by $0.04.
Revenue of $471.32M up 120.2% YoY beats by $17.14M.
Reached market share of 1.18% of U.S. existing home sales by value — 24 basis points
Gross profit was $126 million, up 174% YoY
Net loss was $27.9 million, compared to net loss of $6.6 million (RentPath acquisition)
Outlook
$530-541M revenue 124-128% (consensus: $487.51M)

Stock ended the week down 6%

Friday, August 6
Draftkings 🎰
Full report here
Q2 EPS ($0.26) vs est. ($0.52)
Revenue $298m vs est. $242.4m up 320% YoY
“DraftKings had a particularly strong second quarter of 2021, maintaining our impressive financial performance while also advancing into new areas, such as media and NFTs “
Monthly Unique Payers (“MUPs”) for theB2C segment increased 281% YoY. On average, 1.1 million monthly unique paying customers engaged with DraftKings during each month of the second quarter.
Average Revenue per MUP (“ARPMUP”) was $80 in the second quarter of 2021 representing a 26% increase versus the same period in 2020.
GUIDANCE
FY21 revenue $1.21-1.29B vs est. $1.16B up YoY 88% to 100% and a 14% increase compared to the midpoint of our previous guidance.
Stock ended the week up 5.5%

That’s it for this week! If you liked it please do share it!